
Production Tracking Dashboard That Exposed a Hidden Bottleneck and Unlocked Higher Output for a Food Packaging Company
The company discovered that their perceived capacity ceiling was actually a visibility ceiling, and that the $2.1M capital investment in a fourth production line was not what their growth required. By instrumenting all three existing lines with IoT sensors and deploying real-time OEE tracking, the production analytics platform revealed a hidden bottleneck — including an intermittent sensor fault on Line 2 that had gone undetected for months — and gave operators, supervisors, and leadership the data needed to unlock significantly higher output from their existing equipment. The shift from paper-based logging and estimated downtime to 98% downtime capture and AI-powered anomaly detection fundamentally changed how the company approached production planning and capital allocation.
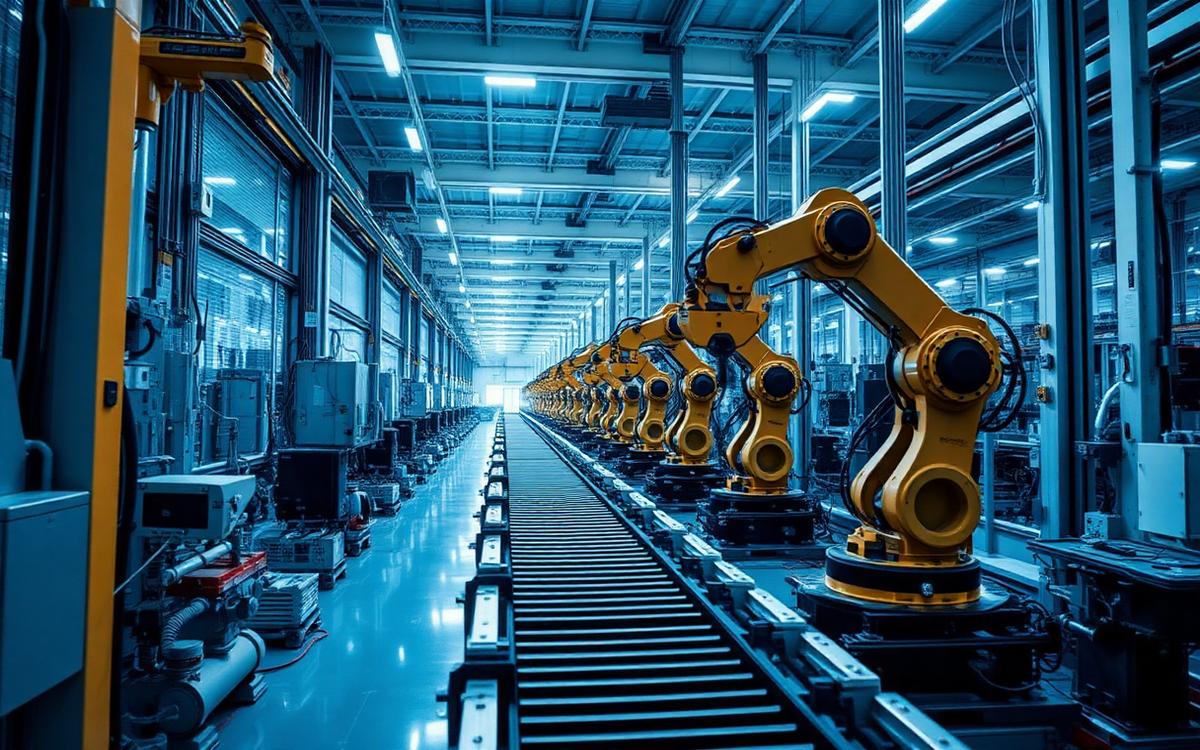
A food packaging company running three production lines and processing 50,000 units per day had plateaued in output despite consistent demand growth. Leadership believed they were operating at capacity and began evaluating a $2.1M capital investment in a fourth production line. Before committing, they engaged JSG to build a production tracking system that would give them visibility into actual line performance — and what the data revealed changed their investment strategy entirely.
Client: A food packaging company
Employee Size: 120 employees
Industry: Manufacturing
Services: - Custom Software Development - AI Automation & Workflow Design - Production Analytics & Dashboards - IoT Integration
The company had been in operation for 18 years and had grown steadily, adding production lines as demand increased. But over the past two years, output had flatlined at roughly 50,000 units per day despite no reduction in staffing, raw material availability, or operating hours. Leadership assumed they had hit the physical ceiling of their equipment and floor space.
The root problem was invisibility. The company had no system to track production performance in real time. Output was measured at the end of each shift by counting finished goods in the staging area. Downtime events were recorded manually in paper logbooks — if they were recorded at all. Supervisors estimated that only about 40% of downtime events were being captured, and even those lacked detail about root cause or duration.
Shift handoffs were another source of lost productivity. Incoming supervisors received verbal summaries from outgoing supervisors, often incomplete or inaccurate. Issues that started on one shift frequently carried over unresolved because the incoming team did not have the context to act on them. A recurring sensor calibration issue on Line 2, for example, had been causing intermittent rejects for weeks but was never escalated because each shift treated it as a one-time event.
OEE (Overall Equipment Effectiveness) was unknown. Leadership could not tell the difference between a line running at 85% effectiveness and one running at 62%. Without that data, they could not prioritize improvements, justify maintenance investments, or hold teams accountable to performance standards.
The proposed fourth production line would take 14 months to install and commission. Leadership needed to know whether they were truly at capacity or whether untapped throughput existed in the three lines they already had.
JSG designed and deployed a real-time production tracking and analytics platform that connected directly to line-level sensors, replaced paper-based logging, and gave leadership OEE visibility for the first time in the company's history.
Key Components
Real-Time Production Monitoring IoT sensors were integrated at critical points on all three production lines to capture unit counts, cycle times, line speed, and run/stop status in real time. Data flowed into a centralized platform that displayed live output against target for every line and every shift.
Automated Downtime Logging The system automatically detected and logged downtime events the moment a line stopped, capturing duration, location, and triggering operators to classify the cause via a tablet-based interface. This replaced the paper logbook and increased downtime capture from an estimated 40% to 98%.
Shift-Level Performance Visibility Performance dashboards broke output, downtime, and quality metrics down by shift, line, and operator team. Supervisors could see exactly how their shift performed relative to the previous shift and the weekly average, creating accountability and healthy competition between crews.
OEE Tracking & Benchmarking Overall Equipment Effectiveness was calculated automatically for every line using availability, performance, and quality inputs. OEE scores were displayed on shop floor monitors and trended over time, giving leadership and operators a shared language for discussing performance.
AI-Powered Anomaly Detection Azure OpenAI models analyzed production data streams to identify anomalies — subtle throughput degradations, unusual downtime patterns, and quality drift — that would be invisible to human observation. The system flagged Line 2's intermittent sensor issue within the first week of operation, a problem that had gone undetected for months.
Threshold-Based Alert Triggers N8N workflows monitored production KPIs against configurable thresholds and triggered real-time alerts when lines fell below target output rates, when downtime exceeded acceptable limits, or when quality reject rates spiked. Alerts went to supervisors via SMS and to leadership via email digest.
## Quantifiable Impact
- 20% increase in total daily output (from 50,000 to 60,200 units/day) without adding equipment or headcount
- Hidden bottleneck on Line 2 identified and resolved within 3 weeks of deployment — a misaligned conveyor guide causing 47 minutes of cumulative micro-stoppages per shift
- OEE improved from an estimated 61% to 79% across all three lines
- Downtime event capture increased from ~40% to 98%
- Average downtime per event reduced by 34% due to faster detection and response
- Shift handoff-related production losses reduced by 72%
- Frontend: Next.js
- Backend: .NET API
- Platform: TMX (production data aggregation, shift management, user roles)
- Cloud: Microsoft Azure
- Database: Azure SQL, Azure Time Series Insights (sensor telemetry)
- AI & Automation: Azure OpenAI (anomaly detection, predictive throughput modeling)
- Dashboards: Power BI (OEE dashboards, shift performance reports, trend analysis)
- Workflow Orchestration: N8N (alert triggers on threshold breaches, downtime escalation, shift report generation)
- IoT: Azure IoT Hub (sensor data ingestion from production lines)
- Communication: Twilio (SMS alerts), SendGrid (email digests)
Ready to Modernize Your Business?
Let's talk about where technology can move the needle first.