

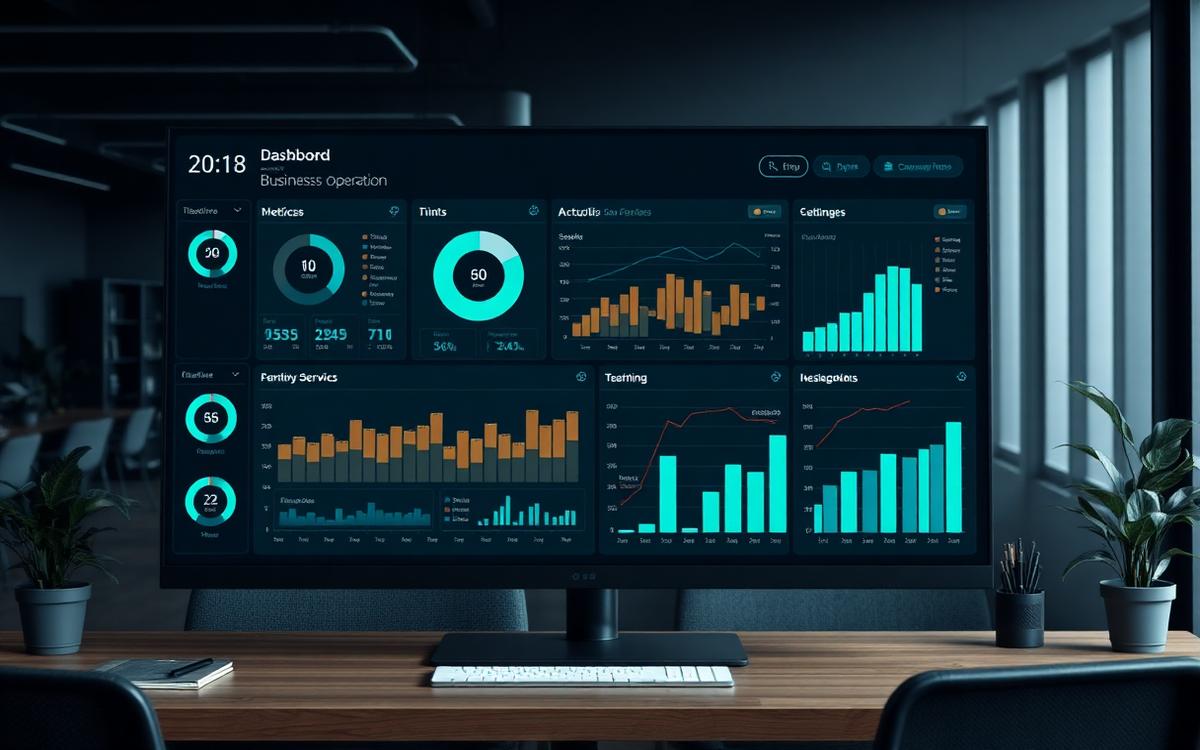
Most business owners make decisions on gut feel because they cannot see their data. Operations dashboards change that -- and the results are immediate and measurable.
Introduction
How did you make your last major business decision? Did you have clear, up-to-date data in front of you? Or did you rely on a combination of experience, instinct, and whatever numbers you could pull together from spreadsheets and memory?
If you are like most small and mid-sized business owners, the honest answer is the latter. Not because you do not value data, but because your data is scattered across multiple tools, trapped in spreadsheets that nobody updates, or locked in systems that were never designed to give you a clear picture of what is happening in your business.
The result is that you are making decisions about hiring, pricing, expansion, and operations without actually knowing how your business is performing right now. Not last month. Not at the end of the quarter. Right now. An operations dashboard solves this problem, and the impact is often visible within the first 30 days.
The Problem
Data without accessibility is useless. And for most businesses, that is exactly the situation they are in.
- What is happening: Businesses generate enormous amounts of operational data every day -- job completions, revenue per service call, technician hours, customer response times, material costs, scheduling efficiency. But this data lives in silos. Some of it is in the CRM. Some is in the accounting software. Some is in scheduling tools. Some is in the dispatcher's head. There is no single place where leadership can see the full picture.
- Why it matters: Without visibility, problems hide. A technician who is consistently underperforming goes unnoticed. A service line that is losing money looks profitable because nobody is tracking the real costs. Scheduling inefficiencies that waste $40,000 a year never get identified because there is no system measuring them. Business owners end up reacting to problems after they have already caused damage, rather than preventing them.
- Who it affects: Every business owner who has ever said "I feel like we should be doing better but I can't tell you exactly where we're losing." Every operations manager who spends hours compiling reports that are outdated by the time they are finished. Every leadership team that debates strategy based on anecdotes instead of evidence.
The irony is that the data you need already exists. It is being generated by your existing tools every day. The missing piece is a system that consolidates it, presents it clearly, and updates it in real time.
The Solution
An operations dashboard is not a nice-to-have reporting tool. It is the command center of your business -- a single view that shows you what is working, what is not, and where your attention is needed most.
Key Points
- Real-Time Visibility Into What Matters A well-designed dashboard pulls data from your CRM, scheduling system, accounting software, and other tools into a single, live view. You see job volume, revenue trends, technician performance, customer response times, and operational bottlenecks -- all updated in real time. No more waiting for end-of-month reports that tell you what went wrong three weeks ago.
- Custom KPIs That Match Your Business Off-the-shelf reports rarely track the metrics that actually matter for your specific operation. A custom dashboard defines and tracks KPIs tailored to how your business runs. For a service business, that might include jobs per technician per day, average time to first response, first-visit completion rate, or revenue per service type. JSG built a dashboard for a commercial HVAC company that tracked 12 KPIs that had never been measured before.
- Automated Reporting That Saves Hours Manual reporting is one of the most wasteful activities in any business. Someone spends hours pulling data from multiple sources, formatting it into a spreadsheet, and presenting it in a meeting where half the numbers are already outdated. Automated dashboards eliminate this entirely. JSG's HVAC client reduced monthly reporting time from 8 hours to 15 minutes and cut weekly leadership meetings from 3 hours to 45 minutes.
- Anomaly Detection and Proactive Alerts Advanced dashboards do not just display data -- they watch it. AI-powered anomaly detection can flag when a KPI falls outside its normal range, alerting you to problems before they escalate. If a technician's completion rate suddenly drops, if response times spike, or if a revenue trend reverses, the system notifies you immediately instead of waiting for someone to notice.
In Practice
JSG partnered with a well-established commercial HVAC company with over 15 years in business and a 30-person team. Despite their market position, leadership was operating with limited visibility into day-to-day performance. Key metrics lived in spreadsheets, inboxes, and the heads of individual managers. Decisions were based on assumptions rather than data.
JSG designed and deployed a real-time operations dashboard that integrated data from the company's CRM, scheduling system, and accounting software. The dashboard included role-based views -- leadership saw strategic metrics while operations teams saw daily execution data. Automated reports replaced manual compilation.
The results were immediate. Within the first 30 days, the dashboard identified $40,000 per year in scheduling waste that had been invisible under the old system. All active jobs became visible in real time, up from roughly 40% that had been tracked manually. Technician performance was measured across 12 KPIs for the first time. And leadership meeting time dropped by 75% because the data was already in front of them.
The dashboard did not just save time. It changed how the company made decisions.
Benefits
- Decisions based on evidence, not instinct -- When you can see your data in real time, every decision you make is better informed and more defensible.
- Hidden inefficiencies exposed immediately -- Problems that would have gone unnoticed for months become visible in days, saving thousands of dollars in waste.
- Hours reclaimed from manual reporting -- Automated dashboards eliminate the time your team spends compiling, formatting, and presenting reports.
- Strategic planning with real data -- Growth decisions around hiring, pricing, expansion, and resource allocation are grounded in actual performance trends, not guesses.
Tools & Technologies
- Power BI -- Microsoft's business intelligence platform, used to build embedded dashboards with role-based views, real-time data visualization, and automated report scheduling.
- Azure OpenAI -- Powers anomaly detection in KPIs and enables natural language queries against business data, allowing non-technical users to ask questions and get answers.
- N8N -- Triggers automated alerts when KPIs breach defined thresholds, ensuring leadership is notified of issues before they escalate.
Ready to get started?
You cannot improve what you cannot see. If your business decisions are based on gut feel, outdated spreadsheets, or last month's numbers, you are flying blind -- and it is costing you more than you think.
JSG builds custom operations dashboards that give business owners and leadership teams the visibility they need to run their companies with confidence. From data integration to KPI design to real-time alerts, we build the complete system.
Book a free 30-minute consultation to find out what an operations dashboard would reveal about your business. Call (240) 725-4925 or visit jsg.com.